![[Experimental]](figures/lifecycle-experimental.svg)
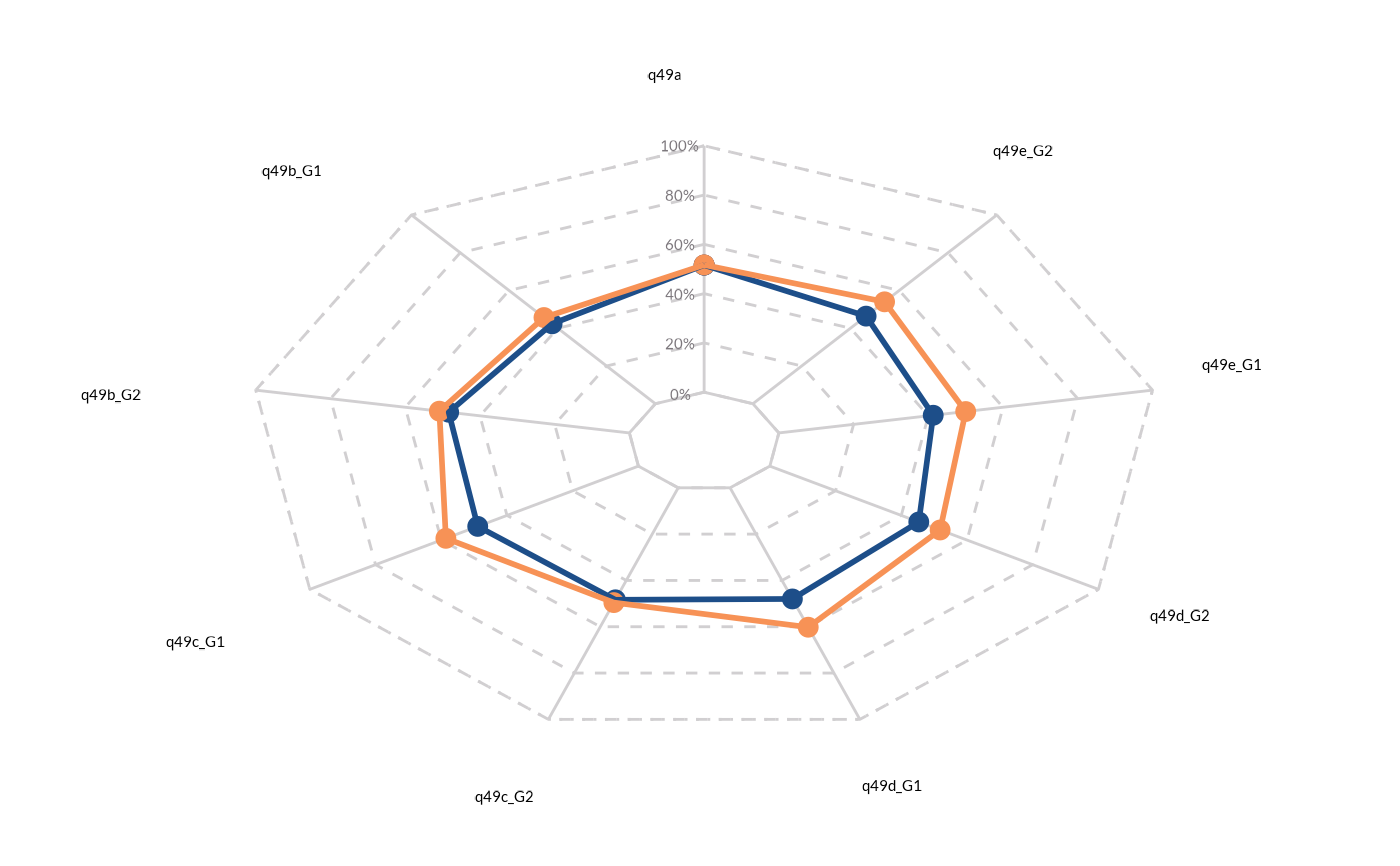
wjp_radar() takes a data frame with a specific data structure (usually long shaped) and returns a ggplot
object with a radar chart following WJP style guidelines.
Usage
wjp_radar(
  data,
  axis_var,
  target,
  labels,
  colors,
  maincat,
  cvec = NULL,
  order_var = NULL,
  source = "GPP"
)
Arguments
- data
A data frame containing the data to be plotted.
- axis_var
A string specifying the variable in the data frame that contains the groups for the axis.
- target
A string specifying the variable in the data frame that contains the values to be plotted.
- labels
A string specifying the variable in the data frame that contains the labels to be displayed.
- colors
A string specifying the variable in the data frame that contains the color groupings.
- maincat
A string indicating the category of labels to show in the radar.
- cvec
A named vector of colors to apply to lines.
- order_var
A string specifying the variable in the data frame that contains the display order of categories. Default is NULL.
- source
A string which can take two values (GPP or QRQ).
Examples
library(dplyr)
library(tidyr)
library(haven)
library(ggplot2)
library(purrr)
library(ggtext)

# Always load the WJP fonts (optional)
wjp_fonts()

# Preparing data
gpp_data <- WJPr::gpp

data4radar <- gpp_data %>%
select(gend, starts_with("q49")) %>%
  mutate(
    gender = case_when(
      gend == 1 ~ "Male",
      gend == 2 ~ "Female"
    ),
    across(
      starts_with("q49"),
      \(x) case_when(
        x <= 2  ~ 1,
        x <= 99 ~ 0
      )
    )
  ) %>%
  group_by(gender) %>%
  summarise(
    across(
      starts_with("q49"),
      \(x) mean(x, na.rm = T)*100
    )
  ) %>%
  pivot_longer(
    !gender,
    names_to  = "category",
    values_to = "percentage"
  ) %>%
  mutate(
    axis_label = category
  )

# Plotting chart
wjp_radar(
  data4radar,
  axis_var    = "category",
  target      = "percentage",
  labels      = "axis_label",
  colors      = "gender"
)
#> Warning: Using one column matrices in `filter()` was deprecated in dplyr 1.1.0.
#> ℹ Please use one dimensional logical vectors instead.
#> ℹ The deprecated feature was likely used in the WJPr package.
#>   Please report the issue at <https://github.com/ctoruno/WJPr/issues>.