Plot a Horizontal Edgebars Chart following WJP style guidelines
Source:R/edgebarsChart.R
wjp_edgebars.Rd![[Experimental]](figures/lifecycle-experimental.svg)
wjp_edgebars() takes a data frame with a specific data structure (usually long shaped) and returns a ggplot
object with an edgebar chart following WJP style guidelines.
Usage
wjp_edgebars(
  data,
  target,
  grouping,
  labels,
  cvec = NULL,
  x_lab_pos = NULL,
  y_lab_pos = 0,
  nudge_lab = 2.5,
  margin_top = 20,
  bar_width = 0.35,
  ptheme = WJP_theme()
)
Arguments
- data
A data frame containing the data to be plotted.
- target
A string specifying the variable in the data frame that contains the numeric values to be plotted as bars.
- grouping
A string specifying the variable in the data frame that contains the categories for the x-axis.
- labels
A string specifying the variable in the data frame that contains the labels to be displayed near the bars.
- cvec
String. Hex code of the color for the bars. Default is NULL.
- x_lab_pos
A string specifying the variable in the data frame that contains the order in which the bars will be displayed. Default is NULL.
- y_lab_pos
A numeric value specifying the y-axis position for displaying labels. Default is 0.
- nudge_lab
A numeric value specifying the padding for displaying labels in milimeters. Default is 2.5.
- margin_top
A numeric value specifying the top margin of the plot. Default is 20.
- bar_width
A numeric value specifying the width of the bars. For single bars the default value of 0.35 is recommended, for plots with two bars a value of 0.5 is more suitable.
- ptheme
A ggplot aesthetic theme to be applied to the chart. Default is the WJP_theme initilized with the package.
Examples
library(dplyr)
library(tidyr)
library(haven)
library(ggplot2)
library(ggtext)
# Always load the WJP fonts (optional)
wjp_fonts()
# Preparing data
gpp_data <- WJPr::gpp
data4bars <- gpp_data %>%
select(country, year, q1a) %>%
group_by(country, year) %>%
mutate(
q1a = as.double(q1a),
trust = case_when(
q1a <= 2 ~ 1,
q1a <= 4 ~ 0,
q1a == 99 ~ NA_real_
),
year = as.character(year)
) %>%
summarise(
trust = mean(trust, na.rm = TRUE),
.groups = "keep"
) %>%
mutate(
trust = trust*100
) %>%
filter(year == "2022") %>%
mutate(
color_variable = country,
value_label = paste0(
format(
round(trust, 0),
nsmall = 0
),
"%"
),
label_position = trust + 5
)
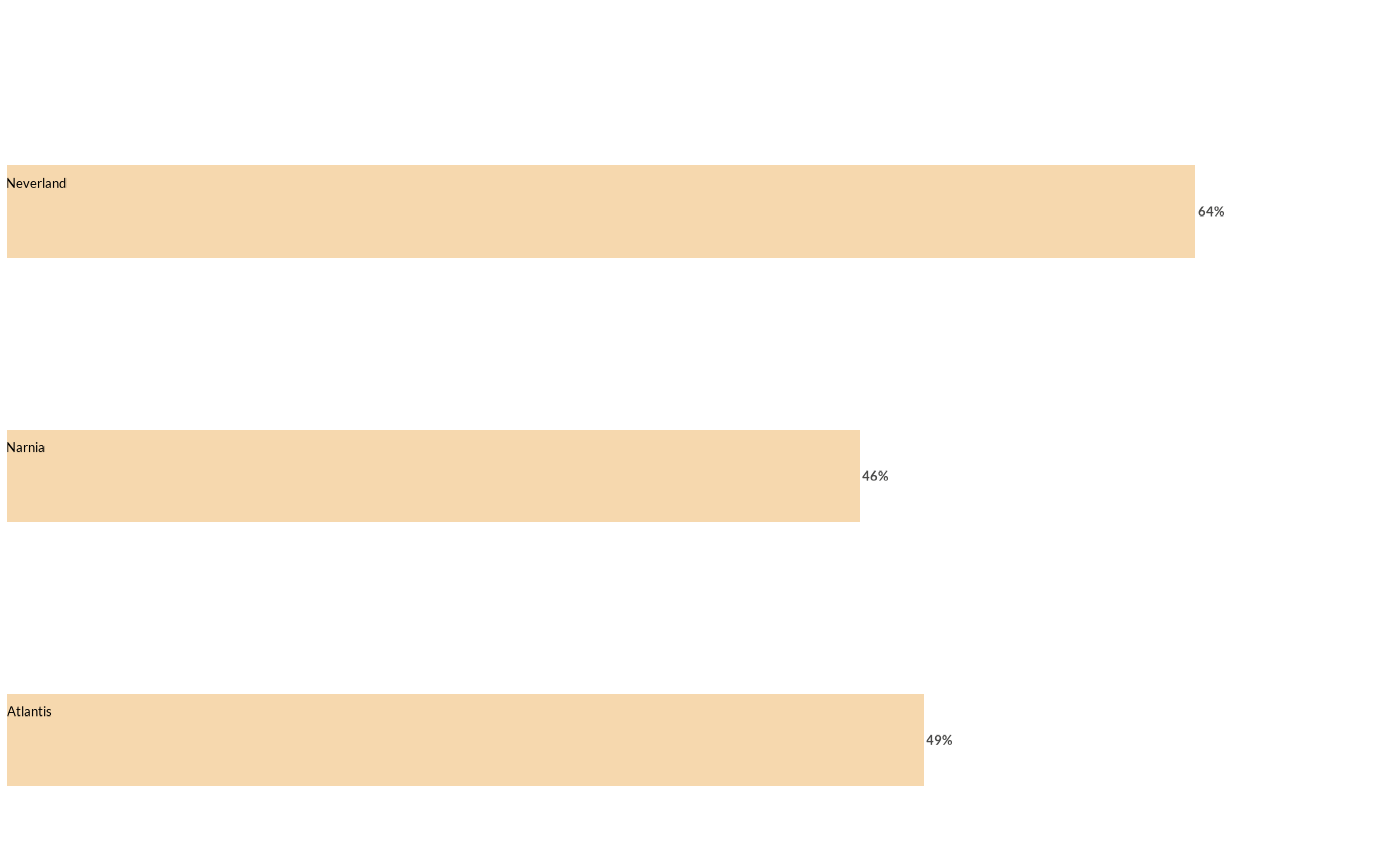
# Plotting chart
wjp_edgebars(
data4bars,
target = "trust",
grouping = "country",
labels = "color_variable",
cvec = "#F6D8AE"
)